After succesfully sending sensor readings to Salesforce on a fixed schedule, and visualizing this data on this platform using Einstein Analytics, we now saw the opportunity to extend the integration functionality to support real-time data retrieval so that when a record was accessed via the Salesforce UI, a request was sent to the sensor to obtain the current values. This would enable our team, our partners, and our clients to check the health of our plants whenever we pleased – a seemingly novel requirement for plants, but often critical when considering IoT for industries such as manufacturing, healthcare, automotive, or retail.
Our previous integration solution was architected following an API-led approach with the accompanying best practices and principles, which meant that instead of simply creating a point-to-point integration between the sensor and Salesforce, we took additional steps to expose the sensor via a HTTP API, and built a batch application to retrieve the data from this API, transform it, and then send the data to Salesforce. While this was undoubtedly more effort than was required to meet the immediate needs, it provided a scalable solution that we could re-use when it came to our next requirement regarding real-time retrieval.
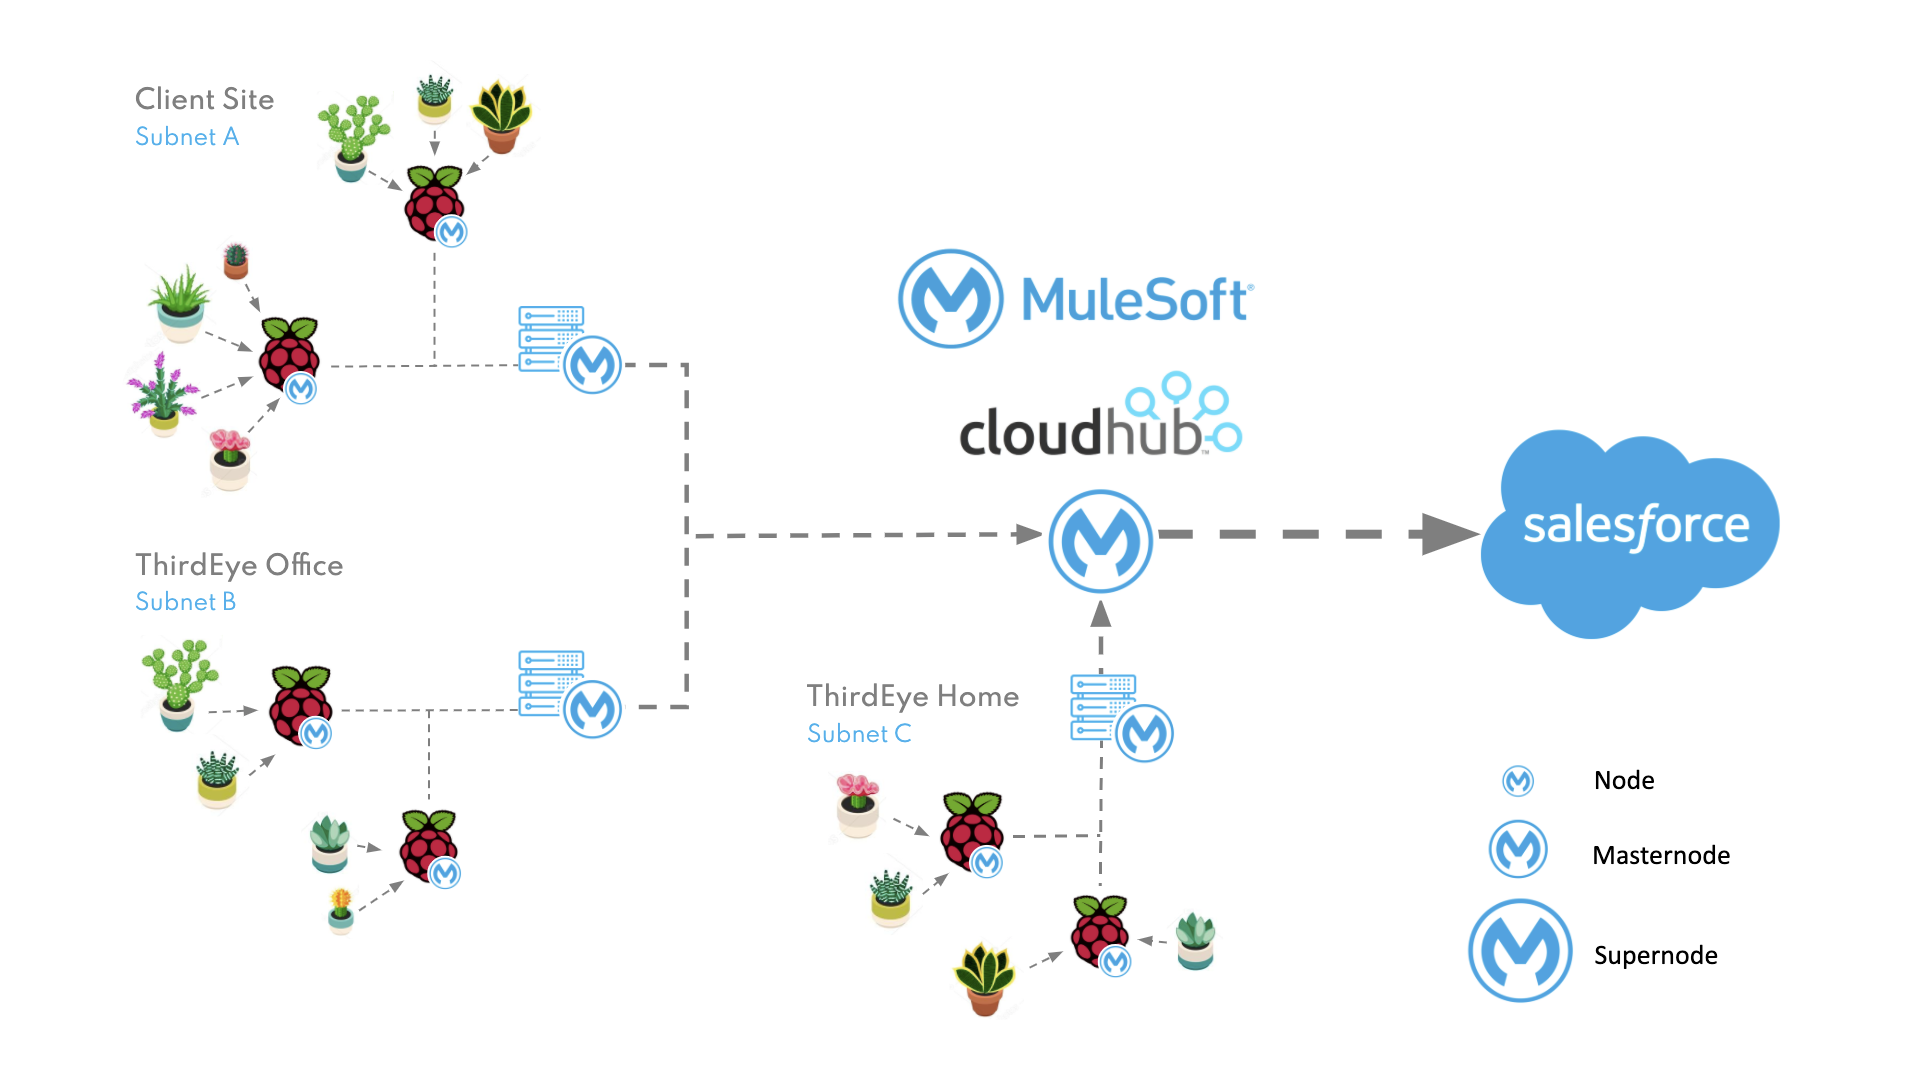
From this starting position we could immediately access each sensor within range of a node (a Raspberry Pi in a cluster of plants) via a HTTP endpoint, with readings from a specific sensor retrievable by passing the sensor ID (a MAC Address) as a URI parameter to the node URL. One potential solution for our real-time retrieval requirement would have been to map each sensor to a node in Salesforce, but we were reluctant to do so for two reasons;
-
We planned to frequently relocate plants to optimise growth based on the metrics obtained, and maintaining the mapping would inevitably prove problematic
-
Salesforce would require access to each node, presenting security challenges for nodes deployed within employee homes and client offices
Instead, following MuleSoft’s three-tier architecture, we implemented a ‘Process API’ to act as our master node and deployed it to infrastructure within each ‘site’ (i.e. on the same subnet as an array of nodes – like an employee’s home or an office). This Process API simultaneously searches all nodes (System APIs) for the required sensor and retrieves the data before returning it to the client. This master node also enabled us to retrieve readings from all available sensors within the site simultaneously and aggregate the results into one single response. From a security point of view, it also meant we could restrict access to the System APIs and regulate inbound traffic to the site via a single point of entry.
The next step was aggregating results between the different sites as we had multiple employees running nodes at home and planned to add additional nodes to each of our client’s offices. We were able to reuse our master node concept and add an additional tier within the process layer which would be deployed to CloudHub and act as our ‘super node’. This API could simultaneously call each of our master nodes and aggregate the results, or it could act as a single endpoint which would search and retrieve the data for any specific sensor within any site (globally).
Containerization of the Mule Runtime
As we were developing our solution remotely, with multiple team members configuring nodes across various sites, it became imperative that we had a consistent development environment, particularly when it came to troubleshooting or debugging.
We were using the on-premise Mule Runtime but hardware varied considerably with a combination of laptops, MacBooks, Raspberry Pis, and a HP ProLiant Microserver, each setup and configured by a different team member. This meant that when anything went wrong during development or deployment, it was proving difficult to isolate the issue despite it often being a simple developer oversight.
We decided to leverage Docker to containerise the Mule Runtime, which enabled us to run one quick command and automatically access the same environment regardless of the hardware in use. This provided a consistent backbone for all of our nodes and master nodes, but also reduced our initial node setup time from a couple of hours to literally minutes.
We had the beginnings of our Application Network with the master nodes and super node now deployed, and the data was being brought to life using Einstein Analytics, so we set upon finding the next integration challenge while the Salesforce team started looking at embedding Lighting Web Components and leveraging Field Service.
Project Vita’s chapters:
- Chapter 1 – Will Your Desk Plant Survive Covid-19?
- Chapter 2 – The Quest for Data
- Chapter 3 – Choosing Scalable Salesforce Tools


